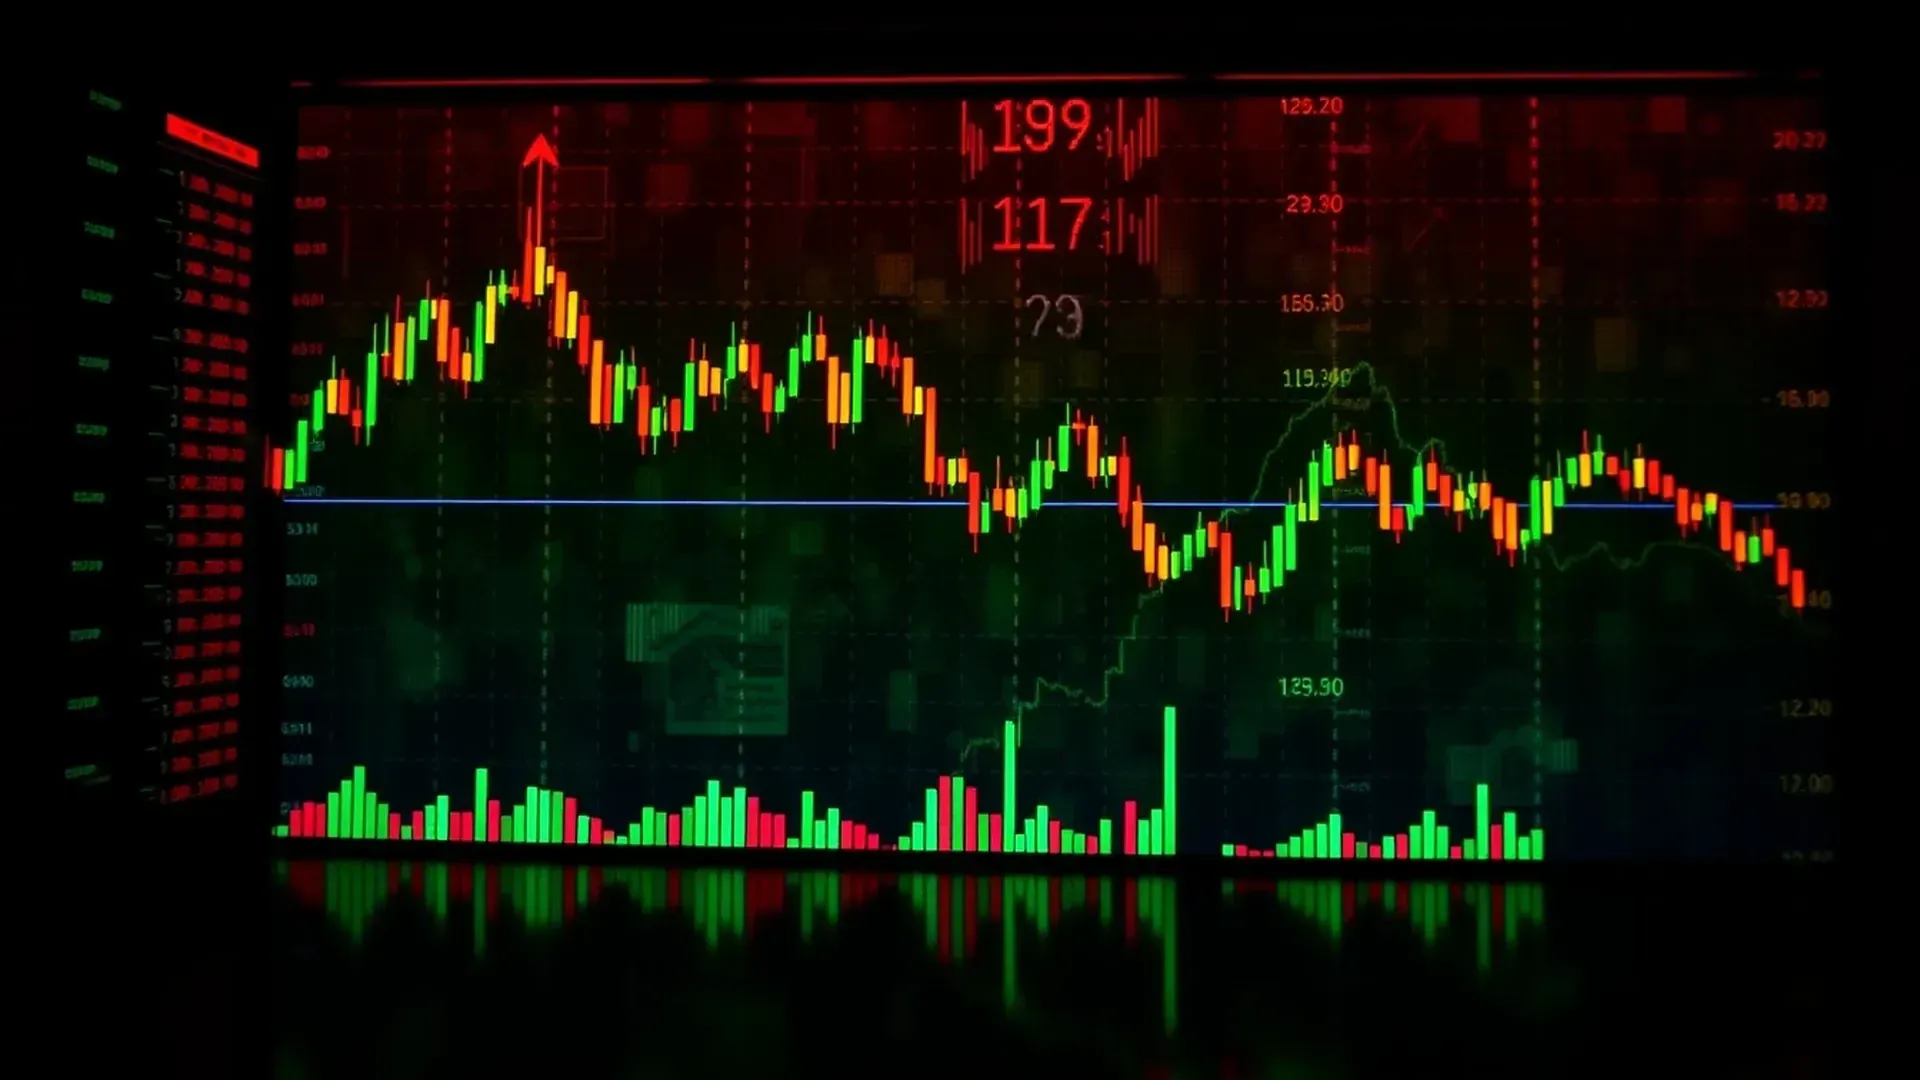
VWAP, or Volume Weighted Average Price, is a popular technical indicator used by traders to analyze the average price at which a security has traded throughout the day, taking into account both price and volume. By incorporating volume into the calculation, VWAP provides a more accurate representation of the true average price. This article will guide you on how to effectively use VWAP to enhance your trading strategy and make more informed trading decisions.
Utilizing VWAP as a Key Indicator in Your Trading Strategy
VWAP, or Volume Weighted Average Price, is a powerful tool that can greatly enhance your trading strategy. Whether you are a seasoned trader or just starting out, incorporating VWAP into your analysis can provide valuable insights and help you make more informed trading decisions.
So, what exactly is VWAP? In simple terms, it is the average price at which a stock has traded throughout the day, weighted by the volume of each trade. This means that stocks with higher trading volumes will have a greater impact on the VWAP calculation. By taking into account both price and volume, VWAP provides a more accurate representation of the true average price of a stock.
One of the key benefits of using VWAP is its ability to identify trends and support and resistance levels. By plotting the VWAP line on your chart, you can easily see whether the price is trading above or below the VWAP. If the price is consistently above the VWAP, it suggests that the stock is in an uptrend, while a price below the VWAP indicates a downtrend. This information can be extremely valuable in determining the overall market sentiment and making trading decisions accordingly.
Another way to utilize VWAP is by using it as a support or resistance level. When the price approaches the VWAP line, it often acts as a magnet, attracting the price towards it. If the price bounces off the VWAP and continues in the same direction, it confirms the strength of the trend. On the other hand, if the price fails to break through the VWAP and reverses, it suggests a potential reversal in the trend. By paying attention to these interactions between the price and the VWAP, you can identify potential entry and exit points for your trades.
In addition to trend identification and support/resistance levels, VWAP can also be used to gauge the strength of a move. When the price is trading far away from the VWAP, it indicates a strong momentum in that direction. Conversely, when the price is trading close to the VWAP, it suggests a lack of conviction and a potential reversal in the near future. By monitoring the distance between the price and the VWAP, you can assess the strength of the current move and adjust your trading strategy accordingly.
It is important to note that VWAP is most effective when used in conjunction with other technical indicators and analysis tools. While it can provide valuable insights on its own, combining it with other indicators such as moving averages, trendlines, and oscillators can further enhance its effectiveness. By using multiple indicators in your analysis, you can confirm signals and increase the probability of successful trades.
In conclusion, VWAP is a powerful tool that can greatly improve your trading strategy. By incorporating it into your analysis, you can identify trends, support and resistance levels, and gauge the strength of a move. However, it is important to remember that VWAP should not be used in isolation and should be combined with other indicators for more accurate analysis. So, why not give VWAP a try and see how it can enhance your trading strategy?
Incorporating VWAP into Your Trading Plan for Better Results
VWAP, or Volume Weighted Average Price, is a powerful tool that can greatly enhance your trading strategy. By incorporating VWAP into your trading plan, you can make more informed decisions and improve your overall results. In this article, we will explore how to effectively use VWAP to take your trading to the next level.
First and foremost, it’s important to understand what VWAP is and how it works. VWAP is a technical indicator that calculates the average price of a security based on both its price and trading volume. Unlike a simple moving average, which gives equal weight to each data point, VWAP places more emphasis on periods with higher trading volume. This makes it a valuable tool for identifying trends and potential entry and exit points.
One way to incorporate VWAP into your trading plan is by using it as a reference point for determining the overall trend of a stock. By comparing the current price to the VWAP, you can get a sense of whether the stock is trading above or below its average price. If the price is consistently above the VWAP, it may indicate a bullish trend, while a price below the VWAP could suggest a bearish trend. This information can help you make more informed decisions about when to buy or sell a stock.
Another way to use VWAP is by using it as a support or resistance level. When a stock is trading above the VWAP, the VWAP can act as a support level, meaning that the stock is more likely to bounce back up if it falls below the VWAP. On the other hand, when a stock is trading below the VWAP, the VWAP can act as a resistance level, indicating that the stock is more likely to face selling pressure if it tries to move above the VWAP. By paying attention to these levels, you can better time your trades and increase your chances of success.
In addition to using VWAP as a reference point and support/resistance level, you can also use it to identify potential entry and exit points. For example, if a stock is trading below the VWAP and then suddenly crosses above it, it could be a signal to buy. Conversely, if a stock is trading above the VWAP and then drops below it, it could be a signal to sell. By combining VWAP with other technical indicators, such as moving averages or trend lines, you can further refine your entry and exit points and increase your profitability.
It’s worth noting that VWAP is most effective when used in conjunction with other indicators and analysis techniques. While it can provide valuable insights on its own, it’s always a good idea to consider multiple factors before making a trading decision. Additionally, it’s important to remember that VWAP is a lagging indicator, meaning that it reflects past price and volume data. As such, it may not always accurately predict future price movements. However, when used in combination with other tools, VWAP can be a powerful addition to your trading arsenal.
In conclusion, incorporating VWAP into your trading plan can greatly improve your results. By using it as a reference point, support/resistance level, and entry/exit signal, you can make more informed decisions and increase your profitability. Just remember to use VWAP in conjunction with other indicators and analysis techniques for the best results. Happy trading!
Enhancing Your Trading Strategy with VWAP Analysis Techniques
VWAP, or Volume Weighted Average Price, is a powerful tool that can greatly enhance your trading strategy. Whether you are a beginner or an experienced trader, incorporating VWAP analysis techniques into your trading can provide valuable insights and improve your overall performance.
So, what exactly is VWAP? In simple terms, VWAP is the average price at which a stock has traded throughout the day, weighted by the volume of each trade. It is a widely used indicator that helps traders identify the average price at which most of the trading activity has occurred.
One of the key benefits of using VWAP is that it helps traders identify the true value of a stock. By comparing the current price of a stock to its VWAP, traders can determine whether the stock is overvalued or undervalued. This information can be extremely valuable when making trading decisions.
Another advantage of using VWAP is that it can help traders identify potential entry and exit points. When the price of a stock is above the VWAP, it suggests that the stock is in an uptrend and may continue to rise. On the other hand, when the price is below the VWAP, it indicates a downtrend and may be a good time to sell or short the stock.
In addition to identifying trends, VWAP can also help traders determine the strength of a trend. By comparing the current price to the VWAP, traders can gauge whether the trend is strong or weak. If the price is consistently above or below the VWAP, it suggests a strong trend. However, if the price is constantly crossing above and below the VWAP, it indicates a weak trend and may be a sign of a potential reversal.
To incorporate VWAP into your trading strategy, there are a few key techniques you can use. One popular technique is to use VWAP as a support or resistance level. When the price of a stock approaches the VWAP, it often acts as a barrier, causing the price to bounce off and reverse direction. By paying attention to these levels, traders can identify potential entry or exit points.
Another technique is to use VWAP in conjunction with other indicators. For example, you can combine VWAP with moving averages to confirm trends. If the price is consistently above the VWAP and the moving average, it suggests a strong uptrend. Conversely, if the price is consistently below both indicators, it indicates a strong downtrend.
It’s important to note that VWAP is not a standalone indicator and should be used in conjunction with other tools and analysis techniques. It is also important to consider the time frame you are trading on. VWAP is most effective on intraday charts, as it is calculated based on the volume and price data of the current trading day.
In conclusion, incorporating VWAP analysis techniques into your trading strategy can greatly enhance your performance. By using VWAP to identify the true value of a stock, determine trends, and gauge the strength of a trend, you can make more informed trading decisions. Remember to use VWAP in conjunction with other indicators and analysis techniques, and consider the time frame you are trading on. With practice and experience, you can become a more successful trader using VWAP.
Maximizing Profits by Integrating VWAP into Your Trading Approach
Are you looking to maximize your profits in the stock market? If so, you may want to consider integrating VWAP into your trading strategy. VWAP, or Volume Weighted Average Price, is a powerful tool that can help you make more informed trading decisions.
So, what exactly is VWAP? In simple terms, it is the average price at which a stock has traded throughout the day, weighted by the volume of each trade. This means that stocks with higher trading volumes will have a greater impact on the VWAP. By using VWAP, you can get a better understanding of the average price at which a stock is being traded, and use this information to your advantage.
One way to use VWAP is to identify potential entry and exit points for your trades. When the price of a stock is above the VWAP, it suggests that the stock is being traded at a higher price than the average for the day. This could indicate that the stock is overvalued and may be a good time to sell. On the other hand, when the price is below the VWAP, it suggests that the stock is being traded at a lower price than the average, which could indicate that the stock is undervalued and may be a good time to buy.
Another way to use VWAP is to confirm trends in the market. If the price of a stock is consistently above the VWAP, it suggests that there is strong buying pressure and that the stock is in an uptrend. Conversely, if the price is consistently below the VWAP, it suggests that there is strong selling pressure and that the stock is in a downtrend. By using VWAP to confirm trends, you can have more confidence in your trading decisions and increase your chances of making profitable trades.
In addition to using VWAP for entry and exit points and confirming trends, you can also use it to set stop-loss orders. A stop-loss order is an order to sell a stock if it reaches a certain price, which can help limit your losses if the stock goes against you. By setting your stop-loss order based on the VWAP, you can ensure that you are not selling too early or too late. For example, if the price of a stock is below the VWAP and you set your stop-loss order just above the VWAP, you can give the stock some room to fluctuate without getting stopped out too early.
It’s important to note that while VWAP can be a valuable tool, it should not be used in isolation. It is always a good idea to consider other factors, such as fundamental analysis and market sentiment, when making trading decisions. VWAP should be used as a complementary tool to help you make more informed decisions, rather than as the sole basis for your trading strategy.
In conclusion, integrating VWAP into your trading strategy can help you maximize your profits in the stock market. By using VWAP to identify entry and exit points, confirm trends, and set stop-loss orders, you can make more informed trading decisions and increase your chances of success. Just remember to use VWAP as a complementary tool and consider other factors when making trading decisions. Happy trading!
Conclusion
In conclusion, incorporating the Volume Weighted Average Price (VWAP) into your trading strategy can be beneficial. By considering both price and volume, VWAP provides a more accurate representation of market trends and helps identify potential entry and exit points. Traders can use VWAP as a reference point to gauge the fair value of an asset and make informed trading decisions. Additionally, VWAP can be used in conjunction with other technical indicators to further enhance trading strategies. Overall, understanding and effectively utilizing VWAP can improve trading outcomes and increase the probability of successful trades.