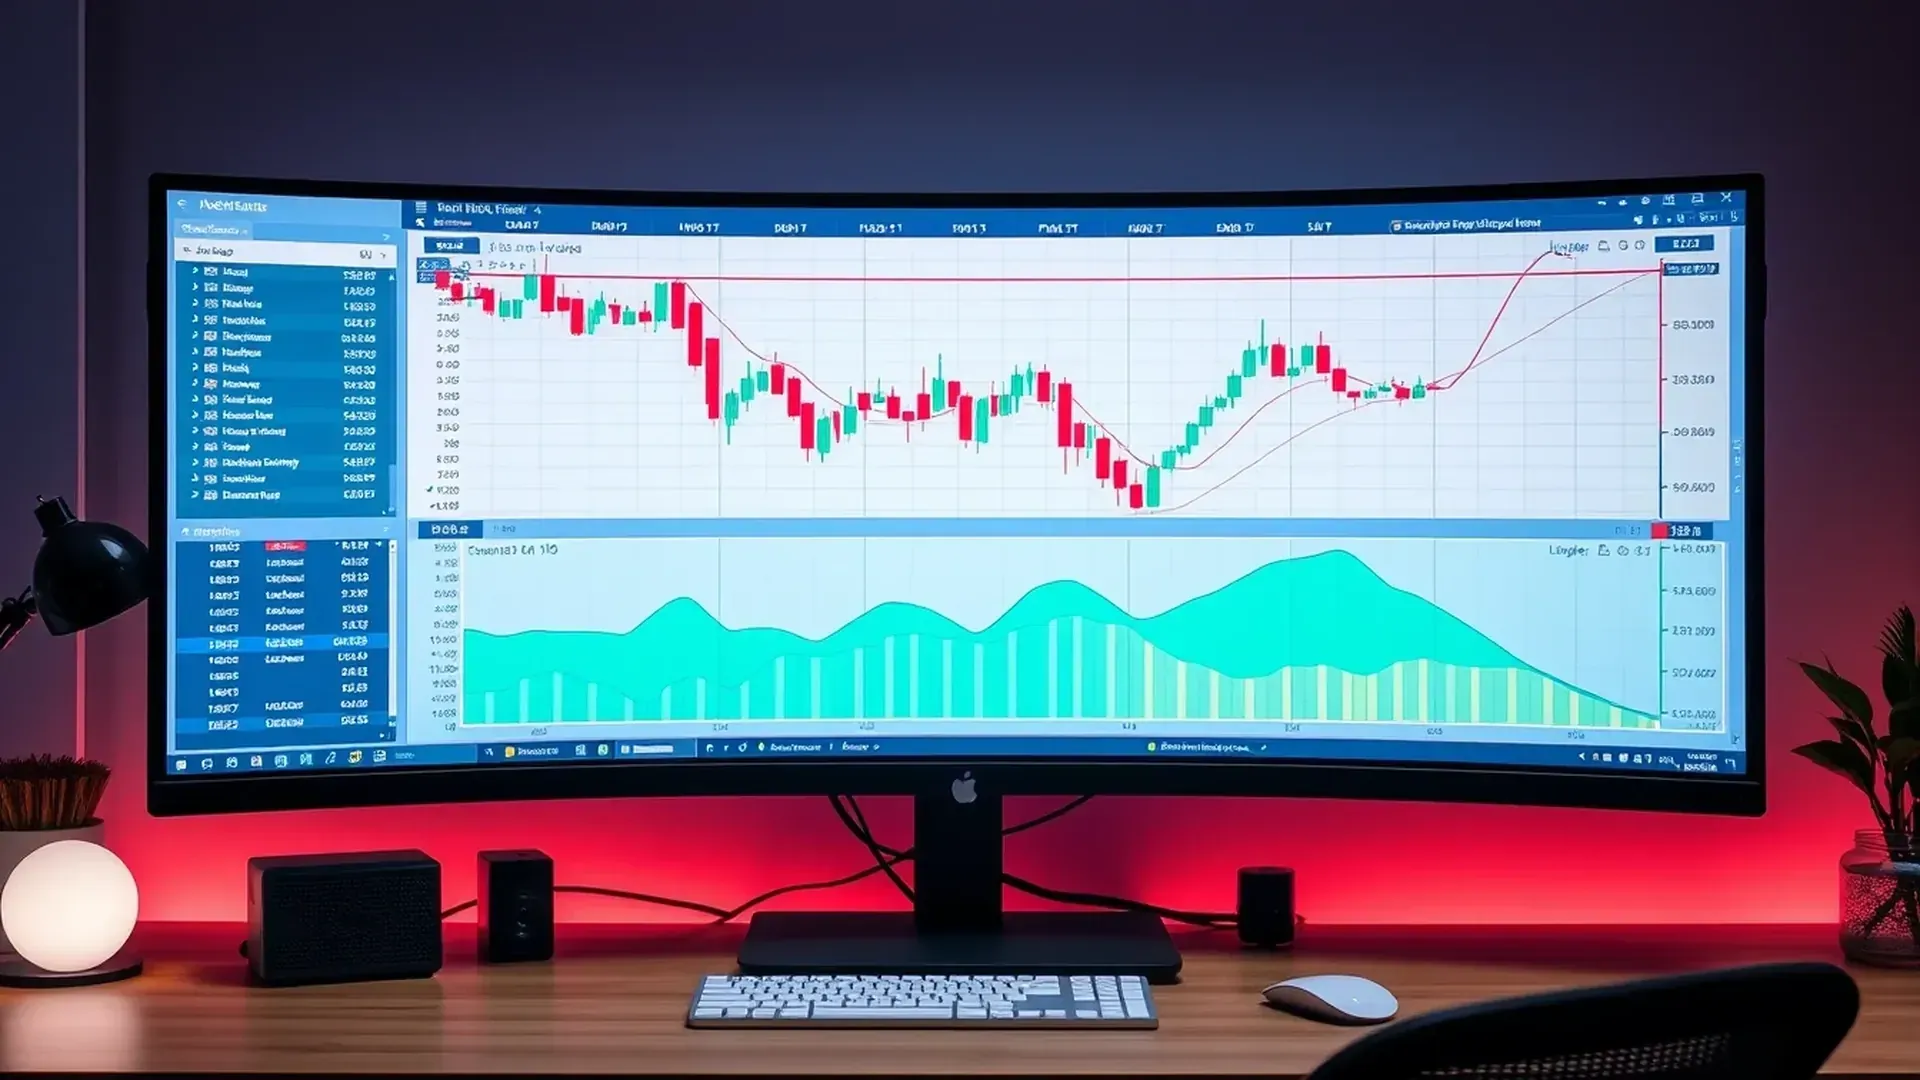
Technical indicators are widely used by forex traders to analyze price movements and identify potential support and resistance levels. These indicators are mathematical calculations based on historical price data and can provide valuable insights into market trends. By understanding how to interpret these indicators, traders can effectively determine support and resistance levels in forex. In this introduction, we will explore the use of technical indicators in identifying these crucial levels and how they can be applied in forex trading.
Using Moving Averages to Identify Support and Resistance Levels in Forex
Technical indicators are powerful tools that can help traders determine support and resistance levels in forex. One popular indicator that is widely used is the moving average. Moving averages are simple yet effective tools that can provide valuable insights into market trends and potential support and resistance levels.
So, how exactly can moving averages be used to identify support and resistance levels in forex? Let’s dive in and find out!
Firstly, it’s important to understand what moving averages are. Moving averages are calculated by taking the average price of a currency pair over a specific period of time. This average is then plotted on a chart, creating a line that moves along with the price action.
Moving averages can be used in different ways to identify support and resistance levels. One common approach is to look for instances where the price bounces off or reacts strongly to a moving average line. These points of interaction can indicate potential support or resistance levels.
For example, if the price of a currency pair is consistently bouncing off a 50-day moving average line and moving higher, it suggests that the moving average is acting as a support level. Traders can use this information to enter long positions when the price approaches the moving average line, with the expectation that it will continue to move higher.
Conversely, if the price is consistently being rejected or finding resistance at a certain moving average line, it indicates that the moving average is acting as a resistance level. Traders can use this information to enter short positions when the price approaches the moving average line, with the expectation that it will reverse and move lower.
It’s worth noting that moving averages can also be used in combination with other indicators to confirm support and resistance levels. For example, traders may look for instances where the price bounces off a moving average line and also coincides with a key Fibonacci retracement level or a trendline.
In addition to identifying support and resistance levels, moving averages can also help traders determine the strength of a trend. When the price is consistently trading above a rising moving average, it suggests that the trend is strong and likely to continue. On the other hand, if the price is consistently trading below a falling moving average, it indicates that the trend is weak and may be reversing.
In conclusion, moving averages are a valuable tool for identifying support and resistance levels in forex. By looking for instances where the price interacts with a moving average line, traders can gain insights into potential entry and exit points. Additionally, moving averages can help confirm the strength of a trend. So, if you’re looking to improve your trading strategy, consider incorporating moving averages into your analysis. Happy trading!
Utilizing Fibonacci Retracement Levels to Determine Support and Resistance in Forex Trading
When it comes to forex trading, one of the key factors that traders need to consider is support and resistance levels. These levels can provide valuable insights into potential price movements and help traders make informed decisions. While there are various methods to determine support and resistance levels, one popular approach is by utilizing Fibonacci retracement levels.
Fibonacci retracement levels are based on the Fibonacci sequence, a mathematical concept that has been used for centuries. The sequence is created by adding the two previous numbers together, starting with 0 and 1. So, the sequence goes like this: 0, 1, 1, 2, 3, 5, 8, 13, 21, and so on. These numbers have unique mathematical properties and can be found in various natural phenomena, including financial markets.
In forex trading, Fibonacci retracement levels are used to identify potential support and resistance levels based on the Fibonacci ratios. The most commonly used ratios are 38.2%, 50%, and 61.8%. These levels are drawn on a price chart to indicate areas where the price is likely to reverse or consolidate.
To use Fibonacci retracement levels effectively, traders need to identify a significant price swing or trend. This can be done by selecting two points on the chart, usually the highest high and the lowest low of a particular trend. Once these points are identified, the Fibonacci retracement levels can be drawn.
The 38.2% level is often considered the first level of support or resistance. If the price retraces to this level and bounces off, it indicates that there is strong support or resistance at that level. The 50% level is considered a stronger level, and if the price retraces to this level and holds, it suggests that the trend is likely to continue. Finally, the 61.8% level is considered the strongest level of support or resistance. If the price retraces to this level and holds, it indicates a high probability of a trend reversal.
It’s important to note that Fibonacci retracement levels should not be used in isolation. They should be used in conjunction with other technical indicators and analysis tools to confirm potential support and resistance levels. For example, traders can use moving averages, trend lines, or candlestick patterns to validate the Fibonacci retracement levels.
Additionally, it’s crucial to understand that support and resistance levels are not fixed. They can change over time as market conditions evolve. Therefore, it’s essential to regularly update and adjust the Fibonacci retracement levels based on new price data.
In conclusion, Fibonacci retracement levels are a valuable tool for determining support and resistance levels in forex trading. By identifying significant price swings and drawing the Fibonacci retracement levels, traders can gain insights into potential areas of support and resistance. However, it’s important to use these levels in conjunction with other technical indicators and analysis tools to confirm their validity. With practice and experience, traders can effectively utilize Fibonacci retracement levels to make informed trading decisions in the forex market.
Exploring Bollinger Bands as Technical Indicators for Support and Resistance Levels in Forex
Bollinger Bands are a popular technical indicator used by forex traders to determine support and resistance levels. These bands were developed by John Bollinger in the 1980s and have since become a staple in technical analysis. In this article, we will explore how Bollinger Bands can be used to identify support and resistance levels in forex trading.
Firstly, let’s understand what Bollinger Bands are. Bollinger Bands consist of three lines: the middle band, the upper band, and the lower band. The middle band is a simple moving average, usually set at 20 periods. The upper and lower bands are calculated by adding and subtracting a standard deviation from the middle band. The standard deviation is a measure of volatility, and by using it in the calculation, Bollinger Bands adjust to market conditions.
Now, let’s dive into how Bollinger Bands can help us identify support and resistance levels. When the price is trading near the upper band, it suggests that the market is overbought, and a reversal or pullback may occur. Conversely, when the price is trading near the lower band, it indicates that the market is oversold, and a potential bounce or reversal may be on the horizon.
The width of the Bollinger Bands can also provide valuable information about support and resistance levels. When the bands are narrow, it suggests that the market is in a period of low volatility. This could indicate a potential breakout or a consolidation phase. On the other hand, when the bands are wide, it suggests that the market is experiencing high volatility. This could indicate a strong trend or a potential reversal.
Another way to use Bollinger Bands for support and resistance levels is by looking for price bounces off the bands. When the price touches or crosses the upper band, it may act as a resistance level, causing the price to reverse or consolidate. Similarly, when the price touches or crosses the lower band, it may act as a support level, causing the price to bounce back up.
It’s important to note that Bollinger Bands should not be used in isolation. They work best when combined with other technical indicators or chart patterns. For example, you can use Bollinger Bands in conjunction with trend lines or Fibonacci retracement levels to confirm support and resistance levels.
In conclusion, Bollinger Bands are a valuable tool for forex traders to determine support and resistance levels. By analyzing the position of the price relative to the bands, the width of the bands, and price bounces off the bands, traders can gain insights into potential reversal points or consolidation phases. However, it’s crucial to use Bollinger Bands in conjunction with other technical indicators or chart patterns for more accurate analysis. So, next time you’re analyzing the forex market, don’t forget to explore the power of Bollinger Bands. Happy trading!
Applying Relative Strength Index (RSI) to Identify Support and Resistance Levels in Forex Trading
The forex market can be a complex and unpredictable place, but there are tools and techniques that traders can use to help them make more informed decisions. One such tool is the Relative Strength Index (RSI), which can be used to identify support and resistance levels in forex trading.
The RSI is a technical indicator that measures the strength and speed of a price movement. It is calculated using a formula that takes into account the average gain and average loss over a specified period of time. The RSI is typically displayed as a line graph that ranges from 0 to 100, with levels above 70 indicating overbought conditions and levels below 30 indicating oversold conditions.
To use the RSI to identify support and resistance levels, traders can look for certain patterns and signals. One common approach is to look for divergences between the RSI and the price movement. For example, if the price of a currency pair is making higher highs, but the RSI is making lower highs, this could be a sign that the price is losing momentum and a potential resistance level is forming.
Conversely, if the price is making lower lows, but the RSI is making higher lows, this could indicate that the price is gaining momentum and a potential support level is forming. These divergences can be used as signals to enter or exit trades, depending on the trader’s strategy and risk tolerance.
Another way to use the RSI to identify support and resistance levels is to look for overbought and oversold conditions. When the RSI is above 70, it is considered overbought, which means that the price may be due for a correction or reversal. Traders can use this as a signal to sell or short a currency pair.
On the other hand, when the RSI is below 30, it is considered oversold, which means that the price may be due for a bounce or reversal. Traders can use this as a signal to buy or go long on a currency pair. By combining these overbought and oversold signals with other technical indicators or price patterns, traders can increase their chances of making profitable trades.
It is important to note that the RSI is just one tool among many that traders can use to analyze the forex market. It should not be used in isolation, but rather in conjunction with other indicators and analysis techniques. Additionally, like any technical indicator, the RSI is not foolproof and can give false signals. Therefore, it is important for traders to use proper risk management and to always be aware of the potential for losses.
In conclusion, the Relative Strength Index (RSI) is a useful tool for identifying support and resistance levels in forex trading. By looking for divergences and overbought/oversold conditions, traders can gain insights into potential price reversals and make more informed trading decisions. However, it is important to use the RSI in conjunction with other indicators and analysis techniques, and to always practice proper risk management.
Conclusion
Technical indicators can be used to determine support and resistance levels in forex by analyzing price patterns, trends, and market momentum. Traders can utilize indicators such as moving averages, trendlines, Fibonacci retracements, and oscillators to identify potential support and resistance levels. These indicators help in identifying key price levels where buying or selling pressure may emerge, allowing traders to make informed decisions about entry and exit points in the forex market. By combining multiple indicators and analyzing historical price data, traders can gain insights into potential support and resistance levels, enhancing their trading strategies and decision-making process.