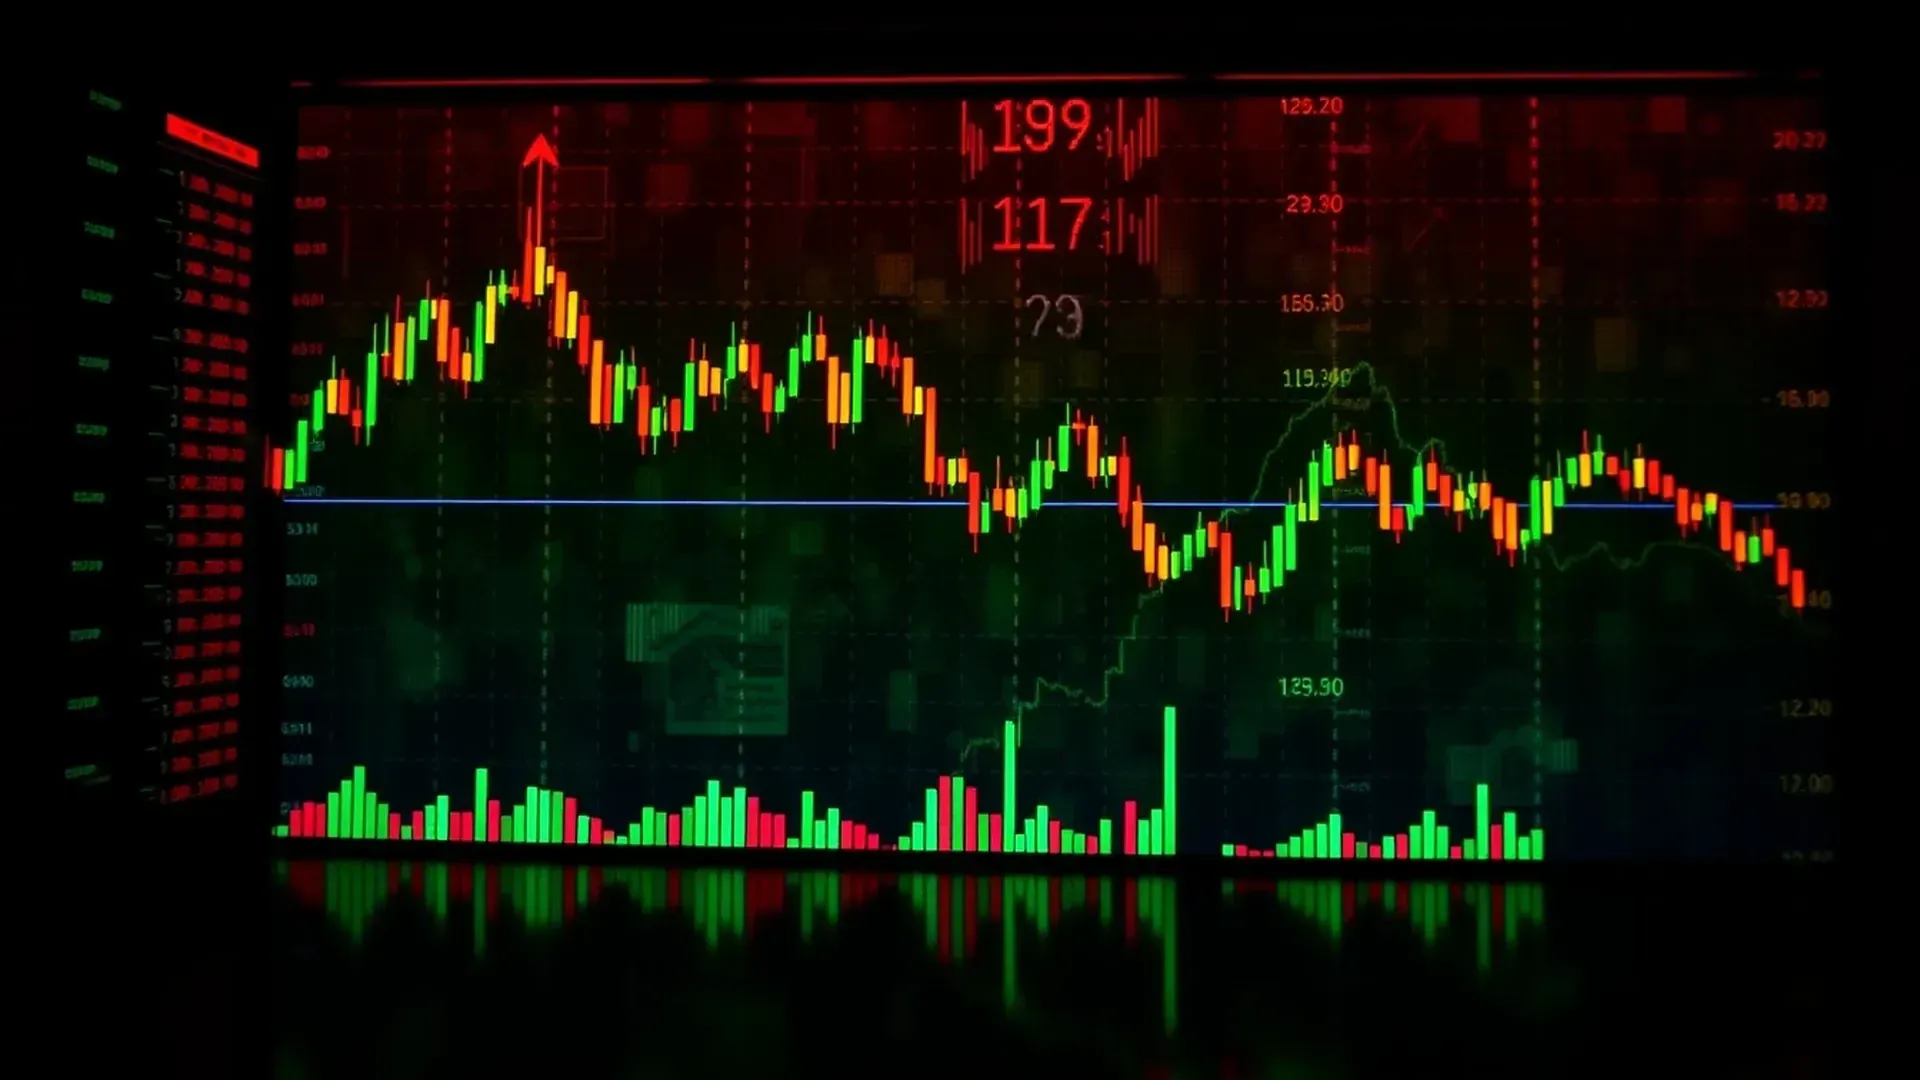
The Williams Accumulation/Distribution (AD) trading strategy is a technical analysis tool used to identify buying and selling pressure in the market. It was developed by Larry Williams and is based on the idea that the volume of trades can provide insight into the strength of a trend. The AD indicator measures the flow of money into and out of a security, and can be used to confirm trends or identify potential reversals. This strategy is commonly used in forex trading, as well as in other financial markets.
Mastering the Williams Accumulation/Distribution Trading Strategy for Forex
Forex trading can be a daunting task, especially for beginners. However, with the right strategy, anyone can become a successful trader. One such strategy is the Williams Accumulation/Distribution Trading Strategy.
The Williams Accumulation/Distribution (WAD) indicator is a momentum indicator that helps traders identify buying and selling pressure in the market. It was developed by Larry Williams, a renowned trader and author of several trading books.
The WAD indicator is based on the principle that the price of an asset is determined by the balance between buying and selling pressure. When there is more buying pressure than selling pressure, the price of the asset goes up, and vice versa.
The WAD indicator calculates the buying and selling pressure by analyzing the volume of trades and the price movement of the asset. It then plots a line that oscillates between positive and negative values, indicating the strength of the buying and selling pressure.
To use the WAD indicator in your trading strategy, you need to understand how to interpret the signals it generates. When the WAD line is moving up, it indicates that there is more buying pressure than selling pressure, and the price of the asset is likely to go up. Conversely, when the WAD line is moving down, it indicates that there is more selling pressure than buying pressure, and the price of the asset is likely to go down.
One way to use the WAD indicator in your trading strategy is to look for divergences between the WAD line and the price of the asset. A divergence occurs when the price of the asset is moving in one direction, while the WAD line is moving in the opposite direction. This indicates a potential reversal in the price trend.
For example, if the price of the asset is going up, but the WAD line is going down, it indicates that there is less buying pressure than there should be, and the price is likely to reverse. Conversely, if the price of the asset is going down, but the WAD line is going up, it indicates that there is less selling pressure than there should be, and the price is likely to reverse.
Another way to use the WAD indicator in your trading strategy is to look for crossovers between the WAD line and the zero line. When the WAD line crosses above the zero line, it indicates that there is more buying pressure than selling pressure, and the price of the asset is likely to go up. Conversely, when the WAD line crosses below the zero line, it indicates that there is more selling pressure than buying pressure, and the price of the asset is likely to go down.
To master the Williams Accumulation/Distribution Trading Strategy, you need to practice using the WAD indicator in your trading. Start by analyzing historical price data and identifying patterns and trends. Then, use the WAD indicator to confirm your analysis and make trading decisions.
Remember, no trading strategy is foolproof, and there is always a risk involved in trading. However, with the right strategy and a disciplined approach, you can become a successful trader and achieve your financial goals. So, start mastering the Williams Accumulation/Distribution Trading Strategy today and take your trading to the next level.
Implementing the Williams Accumulation/Distribution Trading Strategy in Your Forex Trading Plan
Are you looking for a new forex trading strategy to add to your arsenal? Look no further than the Williams Accumulation/Distribution Trading Strategy. This strategy, developed by Larry Williams, is a momentum indicator that can help you identify buying and selling opportunities in the forex market.
So, how does it work? The Williams Accumulation/Distribution (AD) indicator measures the buying and selling pressure of a currency pair. It does this by analyzing the volume and price movements of the pair. When the AD line is moving up, it indicates that buying pressure is increasing, and when it is moving down, it indicates that selling pressure is increasing.
To implement this strategy in your forex trading plan, you first need to add the Williams AD indicator to your chart. This can be done through most trading platforms, such as MetaTrader 4 or 5. Once you have added the indicator, you can begin to analyze the AD line to identify potential trading opportunities.
One way to use the Williams AD indicator is to look for divergences between the AD line and the price of the currency pair. For example, if the price of the pair is trending upwards, but the AD line is trending downwards, it could indicate that the buying pressure is weakening, and a potential sell signal may be forming. Conversely, if the price is trending downwards, but the AD line is trending upwards, it could indicate that the selling pressure is weakening, and a potential buy signal may be forming.
Another way to use the Williams AD indicator is to look for crossovers of the AD line with the zero line. When the AD line crosses above the zero line, it indicates that buying pressure is increasing, and a potential buy signal may be forming. When the AD line crosses below the zero line, it indicates that selling pressure is increasing, and a potential sell signal may be forming.
It is important to note that the Williams AD indicator should not be used in isolation. It should be used in conjunction with other technical indicators and fundamental analysis to confirm potential trading opportunities. Additionally, it is important to practice proper risk management techniques, such as setting stop-loss orders and limiting your position sizes, to minimize potential losses.
In conclusion, the Williams Accumulation/Distribution Trading Strategy is a useful tool for identifying potential buying and selling opportunities in the forex market. By analyzing the AD line, traders can gain insight into the buying and selling pressure of a currency pair and make informed trading decisions. However, it is important to use this strategy in conjunction with other technical indicators and fundamental analysis, and to practice proper risk management techniques to minimize potential losses. Happy trading!
Conclusion
The Williams Accumulation/Distribution Trading Strategy is a popular technical analysis tool used in Forex trading. It is based on the idea that the price of a currency is determined by the supply and demand of that currency. The strategy uses the Accumulation/Distribution line to identify trends and potential trading opportunities. Traders can use this strategy to enter and exit trades based on the signals generated by the indicator. Overall, the Williams Accumulation/Distribution Trading Strategy can be a useful tool for Forex traders looking to make informed trading decisions.