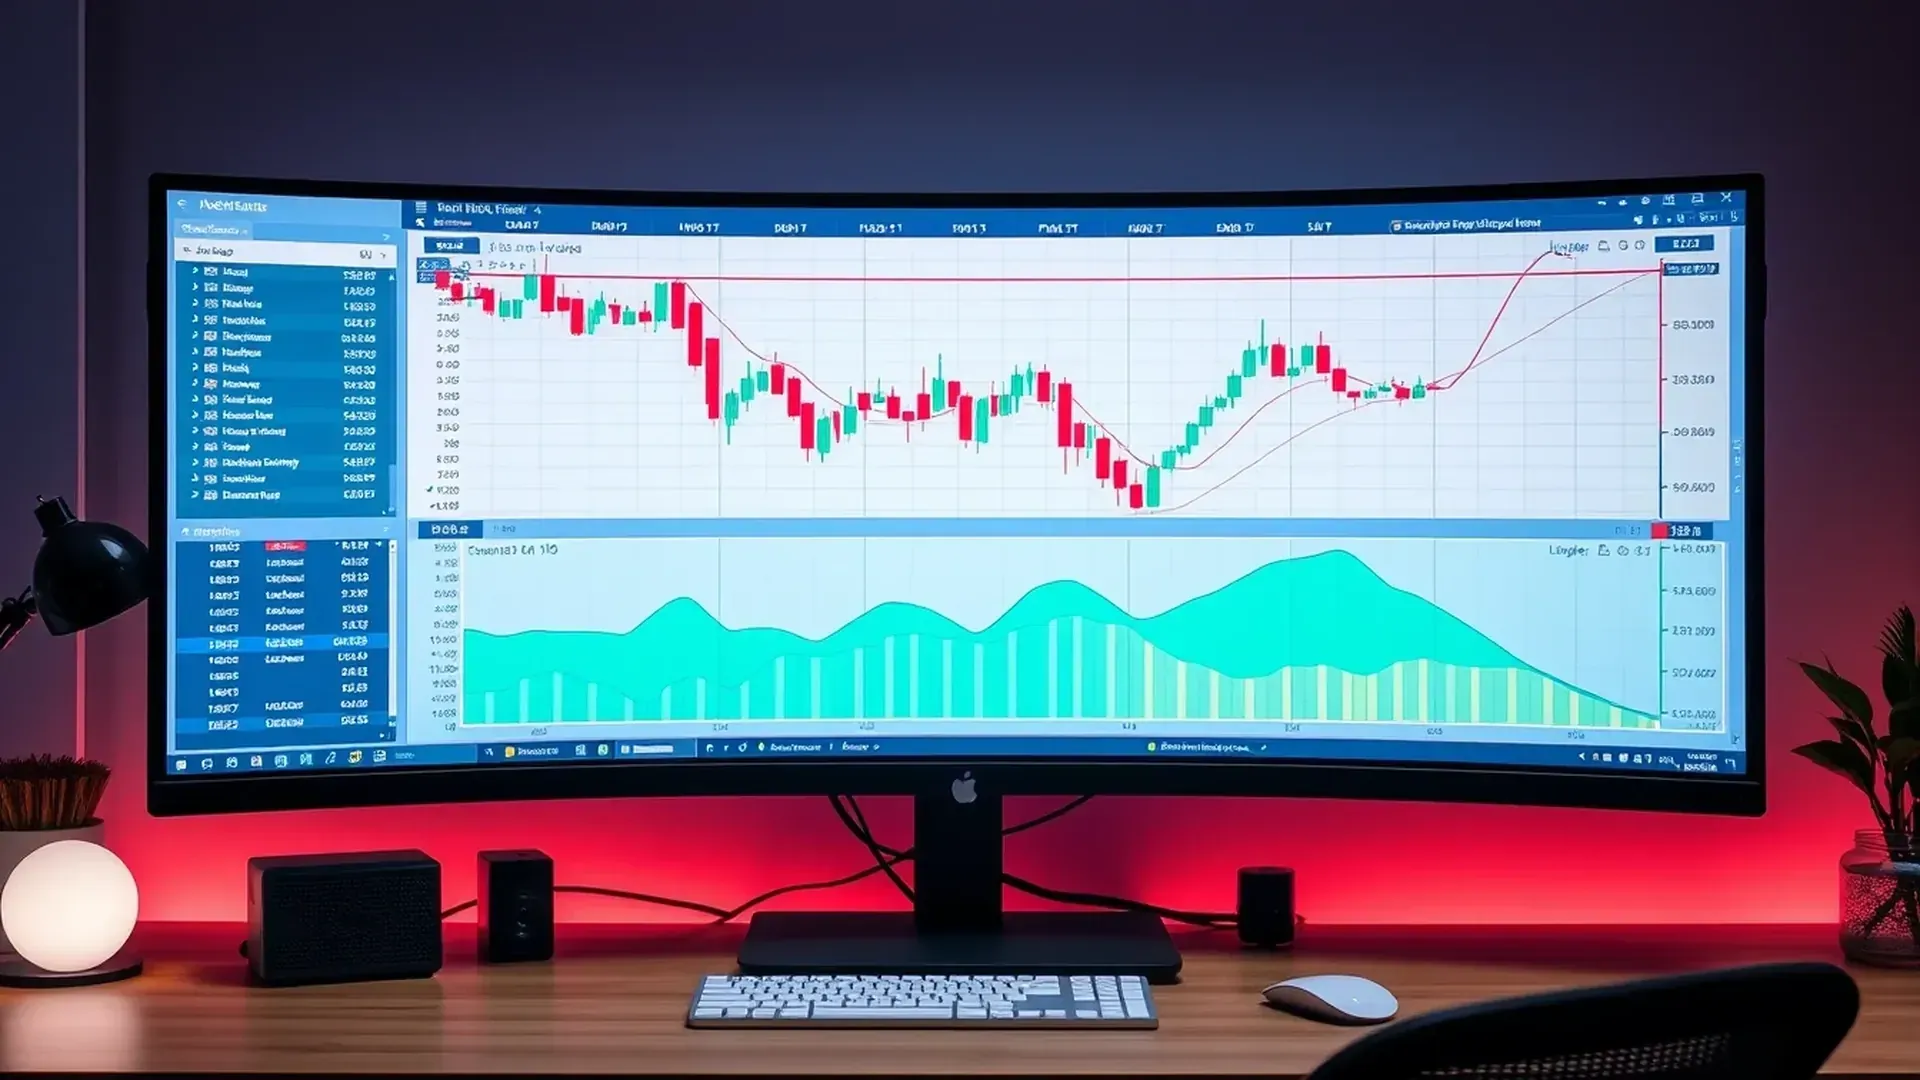
Heikin Ashi charts are a popular tool used by traders to improve their risk management strategies. These charts provide a unique way of visualizing price movements and can help traders identify trends, reversals, and potential entry and exit points. By incorporating Heikin Ashi charts into their analysis, traders can gain a better understanding of market dynamics and make more informed decisions to mitigate risks and enhance their trading performance.
Understanding the Basics of Heikin Ashi Charts for Effective Risk Management
Using Heikin Ashi Charts to Improve Your Risk Management
If you’re looking to improve your risk management strategies in trading, Heikin Ashi charts can be a valuable tool to add to your arsenal. These charts, which originated in Japan, provide a unique way of visualizing price action and can help you make more informed decisions when it comes to managing your trades.
So, what exactly are Heikin Ashi charts? Well, unlike traditional candlestick charts that display the open, high, low, and close prices for each time period, Heikin Ashi charts use a modified formula to calculate the values. This modification smooths out the price action and provides a clearer picture of the overall trend.
One of the key benefits of using Heikin Ashi charts is that they can help you identify trends more easily. By smoothing out the price action, these charts make it easier to spot the direction of the market. This can be particularly useful for traders who prefer to follow trends and want to avoid getting caught in choppy or sideways markets.
Another advantage of Heikin Ashi charts is that they can help you manage your risk more effectively. Since these charts provide a clearer picture of the trend, you can use them to set more accurate stop-loss levels. By placing your stop-loss orders based on the Heikin Ashi chart, you can reduce the risk of getting stopped out prematurely or setting your stop-loss too far away.
In addition to managing your risk, Heikin Ashi charts can also help you identify potential reversal points. The modified formula used in these charts places more emphasis on the closing price, which can help you spot when the trend is losing momentum. This can be a valuable signal for traders who are looking to exit their positions or even reverse their trades.
To effectively use Heikin Ashi charts for risk management, it’s important to understand how to interpret the different patterns that can appear on the chart. For example, a series of green candles with small or no lower shadows indicates a strong uptrend, while a series of red candles with small or no upper shadows indicates a strong downtrend. These patterns can help you determine the strength of the trend and adjust your risk management strategies accordingly.
It’s worth noting that Heikin Ashi charts are not a standalone tool for risk management. They should be used in conjunction with other technical analysis tools and indicators to confirm your trading decisions. Additionally, it’s important to practice proper risk management techniques, such as setting appropriate position sizes and using stop-loss orders, to protect your capital.
In conclusion, Heikin Ashi charts can be a valuable tool for improving your risk management strategies in trading. By providing a clearer picture of the trend and helping you identify potential reversal points, these charts can help you make more informed decisions and reduce the risk of losses. However, it’s important to use Heikin Ashi charts in conjunction with other tools and indicators and to practice proper risk management techniques to ensure long-term success in trading.
Implementing Heikin Ashi Charts in Forex Trading for Enhanced Risk Management
Using Heikin Ashi Charts to Improve Your Risk Management
If you’re a forex trader, you know that managing risk is crucial to your success. One tool that can help you in this endeavor is the Heikin Ashi chart. This charting technique is gaining popularity among traders due to its ability to provide a clearer picture of price trends and help identify potential reversals. In this article, we will explore how implementing Heikin Ashi charts in forex trading can enhance your risk management strategies.
Firstly, let’s understand what Heikin Ashi charts are. Unlike traditional candlestick charts, Heikin Ashi charts use modified candlesticks that factor in the average price movement. This modification smooths out the price action, making it easier to identify trends and potential reversals. The chart’s color scheme also helps traders quickly determine whether the market is in an uptrend or a downtrend.
One of the key advantages of Heikin Ashi charts is their ability to filter out market noise. By using an average of the open, close, high, and low prices, these charts provide a more accurate representation of price movements. This can be particularly useful in volatile markets where sudden price spikes and whipsaws can lead to false signals. By reducing the impact of these erratic price movements, Heikin Ashi charts help traders make more informed decisions and avoid unnecessary risks.
Another benefit of using Heikin Ashi charts is their ability to highlight potential trend reversals. Traditional candlestick charts often require traders to interpret complex patterns and formations to identify reversals. However, Heikin Ashi charts simplify this process by clearly indicating when the market sentiment is shifting. Reversal signals on Heikin Ashi charts are typically characterized by a change in the color of the candlesticks, making it easier for traders to spot potential turning points.
Implementing Heikin Ashi charts in your risk management strategy can also help you set more effective stop-loss levels. Stop-loss orders are essential for limiting potential losses in forex trading. However, determining the optimal placement of these orders can be challenging. Heikin Ashi charts can assist in this regard by providing clearer support and resistance levels. These levels are often more reliable on Heikin Ashi charts due to the smoothing effect of the average price movement. By placing stop-loss orders at these levels, traders can minimize their risk exposure and protect their capital more effectively.
Furthermore, Heikin Ashi charts can be used in conjunction with other technical indicators to confirm trading signals and improve risk management. For example, combining Heikin Ashi charts with moving averages can help traders identify strong trends and filter out false signals. Similarly, using oscillators such as the Relative Strength Index (RSI) or the Stochastic Oscillator alongside Heikin Ashi charts can provide additional confirmation of overbought or oversold conditions. By using multiple indicators, traders can reduce the likelihood of entering trades with higher risk and increase the probability of profitable trades.
In conclusion, implementing Heikin Ashi charts in forex trading can significantly enhance your risk management strategies. These charts provide a clearer picture of price trends, filter out market noise, and help identify potential reversals. By using Heikin Ashi charts, traders can set more effective stop-loss levels, confirm trading signals with other technical indicators, and ultimately reduce their risk exposure. So, if you’re looking to improve your risk management in forex trading, consider incorporating Heikin Ashi charts into your analysis.
Utilizing Heikin Ashi Charts in Cryptocurrency Trading to Mitigate Risk
Cryptocurrency trading can be an exciting and potentially profitable venture, but it also comes with its fair share of risks. One way to mitigate these risks is by utilizing Heikin Ashi charts, a popular tool among traders. These charts can provide valuable insights into market trends and help you make more informed decisions.
So, what exactly are Heikin Ashi charts? Well, they are a type of candlestick chart that uses a modified formula to calculate the opening, closing, high, and low prices of an asset. Unlike traditional candlestick charts, Heikin Ashi charts smooth out the price action, making it easier to identify trends and patterns.
One of the main advantages of using Heikin Ashi charts is that they can help you filter out market noise. In other words, they can help you separate the signal from the noise and focus on the most relevant price movements. This can be particularly useful in the volatile world of cryptocurrency trading, where prices can fluctuate wildly in a short period.
Another benefit of Heikin Ashi charts is that they can help you identify trend reversals. By analyzing the patterns formed by the Heikin Ashi candles, you can get a sense of whether the market is likely to continue in its current direction or reverse course. This can be invaluable information when it comes to managing your risk and deciding when to enter or exit a trade.
Furthermore, Heikin Ashi charts can also help you set more accurate stop-loss levels. A stop-loss order is a predetermined price at which you will exit a trade to limit your losses. By using Heikin Ashi charts, you can identify key support and resistance levels more easily, which can help you determine where to place your stop-loss orders. This can help you protect your capital and minimize potential losses.
Of course, like any tool, Heikin Ashi charts are not foolproof. They are just one piece of the puzzle and should be used in conjunction with other technical analysis tools and indicators. It’s also important to remember that no chart or indicator can predict the future with 100% accuracy. The market is inherently unpredictable, and there will always be a degree of risk involved in trading.
That being said, incorporating Heikin Ashi charts into your trading strategy can certainly improve your risk management. By providing a clearer picture of market trends and helping you set more accurate stop-loss levels, these charts can help you make more informed decisions and reduce the likelihood of significant losses.
In conclusion, Heikin Ashi charts are a valuable tool for cryptocurrency traders looking to improve their risk management. By filtering out market noise, identifying trend reversals, and helping you set more accurate stop-loss levels, these charts can provide valuable insights into market trends and help you make more informed decisions. However, it’s important to remember that no tool can guarantee success in the market, and there will always be a degree of risk involved. So, use Heikin Ashi charts as part of a comprehensive trading strategy and always be prepared for the unexpected.
Advanced Techniques for Risk Management with Heikin Ashi Charts in Futures Trading
Using Heikin Ashi Charts to Improve Your Risk Management
If you’re involved in futures trading, you know that managing risk is crucial to your success. One tool that can help you in this endeavor is Heikin Ashi charts. These charts provide a unique perspective on price action and can be a valuable addition to your risk management strategy.
Heikin Ashi charts are a type of candlestick chart that uses a modified formula to calculate the open, close, high, and low prices. The result is a smoother representation of price movement, which can make it easier to identify trends and reversals. This can be particularly useful when it comes to managing risk.
One way Heikin Ashi charts can help with risk management is by providing clearer signals for entry and exit points. Traditional candlestick charts can sometimes be noisy, with lots of small fluctuations that can make it difficult to determine when to enter or exit a trade. Heikin Ashi charts, on the other hand, smooth out these fluctuations, making it easier to identify significant price movements.
For example, let’s say you’re considering entering a long position in a futures contract. On a traditional candlestick chart, you might see a lot of small, indecisive candles that make it hard to determine if the price is really moving in your favor. However, on a Heikin Ashi chart, these small candles would be smoothed out, and you would be able to see a clearer trend. This can help you make more informed decisions about when to enter or exit a trade, reducing the risk of getting caught in a false breakout or reversal.
Another way Heikin Ashi charts can improve your risk management is by helping you identify potential support and resistance levels. Support and resistance levels are areas on a chart where the price has historically had a difficult time moving above or below. These levels can act as barriers to price movement and can be useful for setting stop-loss orders or profit targets.
On a Heikin Ashi chart, support and resistance levels can be easier to identify because the smoothing effect of the chart makes it easier to see where the price has consistently struggled to move beyond. This can help you set more accurate stop-loss orders, reducing the risk of significant losses if the price moves against you.
In addition to these benefits, Heikin Ashi charts can also be used in conjunction with other technical indicators to further improve your risk management. For example, you could use a moving average crossover strategy with Heikin Ashi charts to generate buy and sell signals. By combining these two tools, you can increase the probability of entering and exiting trades at the right time, reducing the risk of being caught on the wrong side of a trend.
In conclusion, Heikin Ashi charts can be a valuable tool for improving your risk management in futures trading. By providing clearer signals for entry and exit points, helping you identify support and resistance levels, and working in conjunction with other technical indicators, Heikin Ashi charts can help you make more informed decisions and reduce the risk of significant losses. So, if you’re looking to take your risk management to the next level, consider incorporating Heikin Ashi charts into your trading strategy.
Conclusion
In conclusion, using Heikin Ashi charts can be a valuable tool in improving risk management. These charts provide a clearer representation of price trends and help identify potential reversals or trend continuations. By incorporating Heikin Ashi charts into risk management strategies, traders can make more informed decisions and potentially reduce losses.